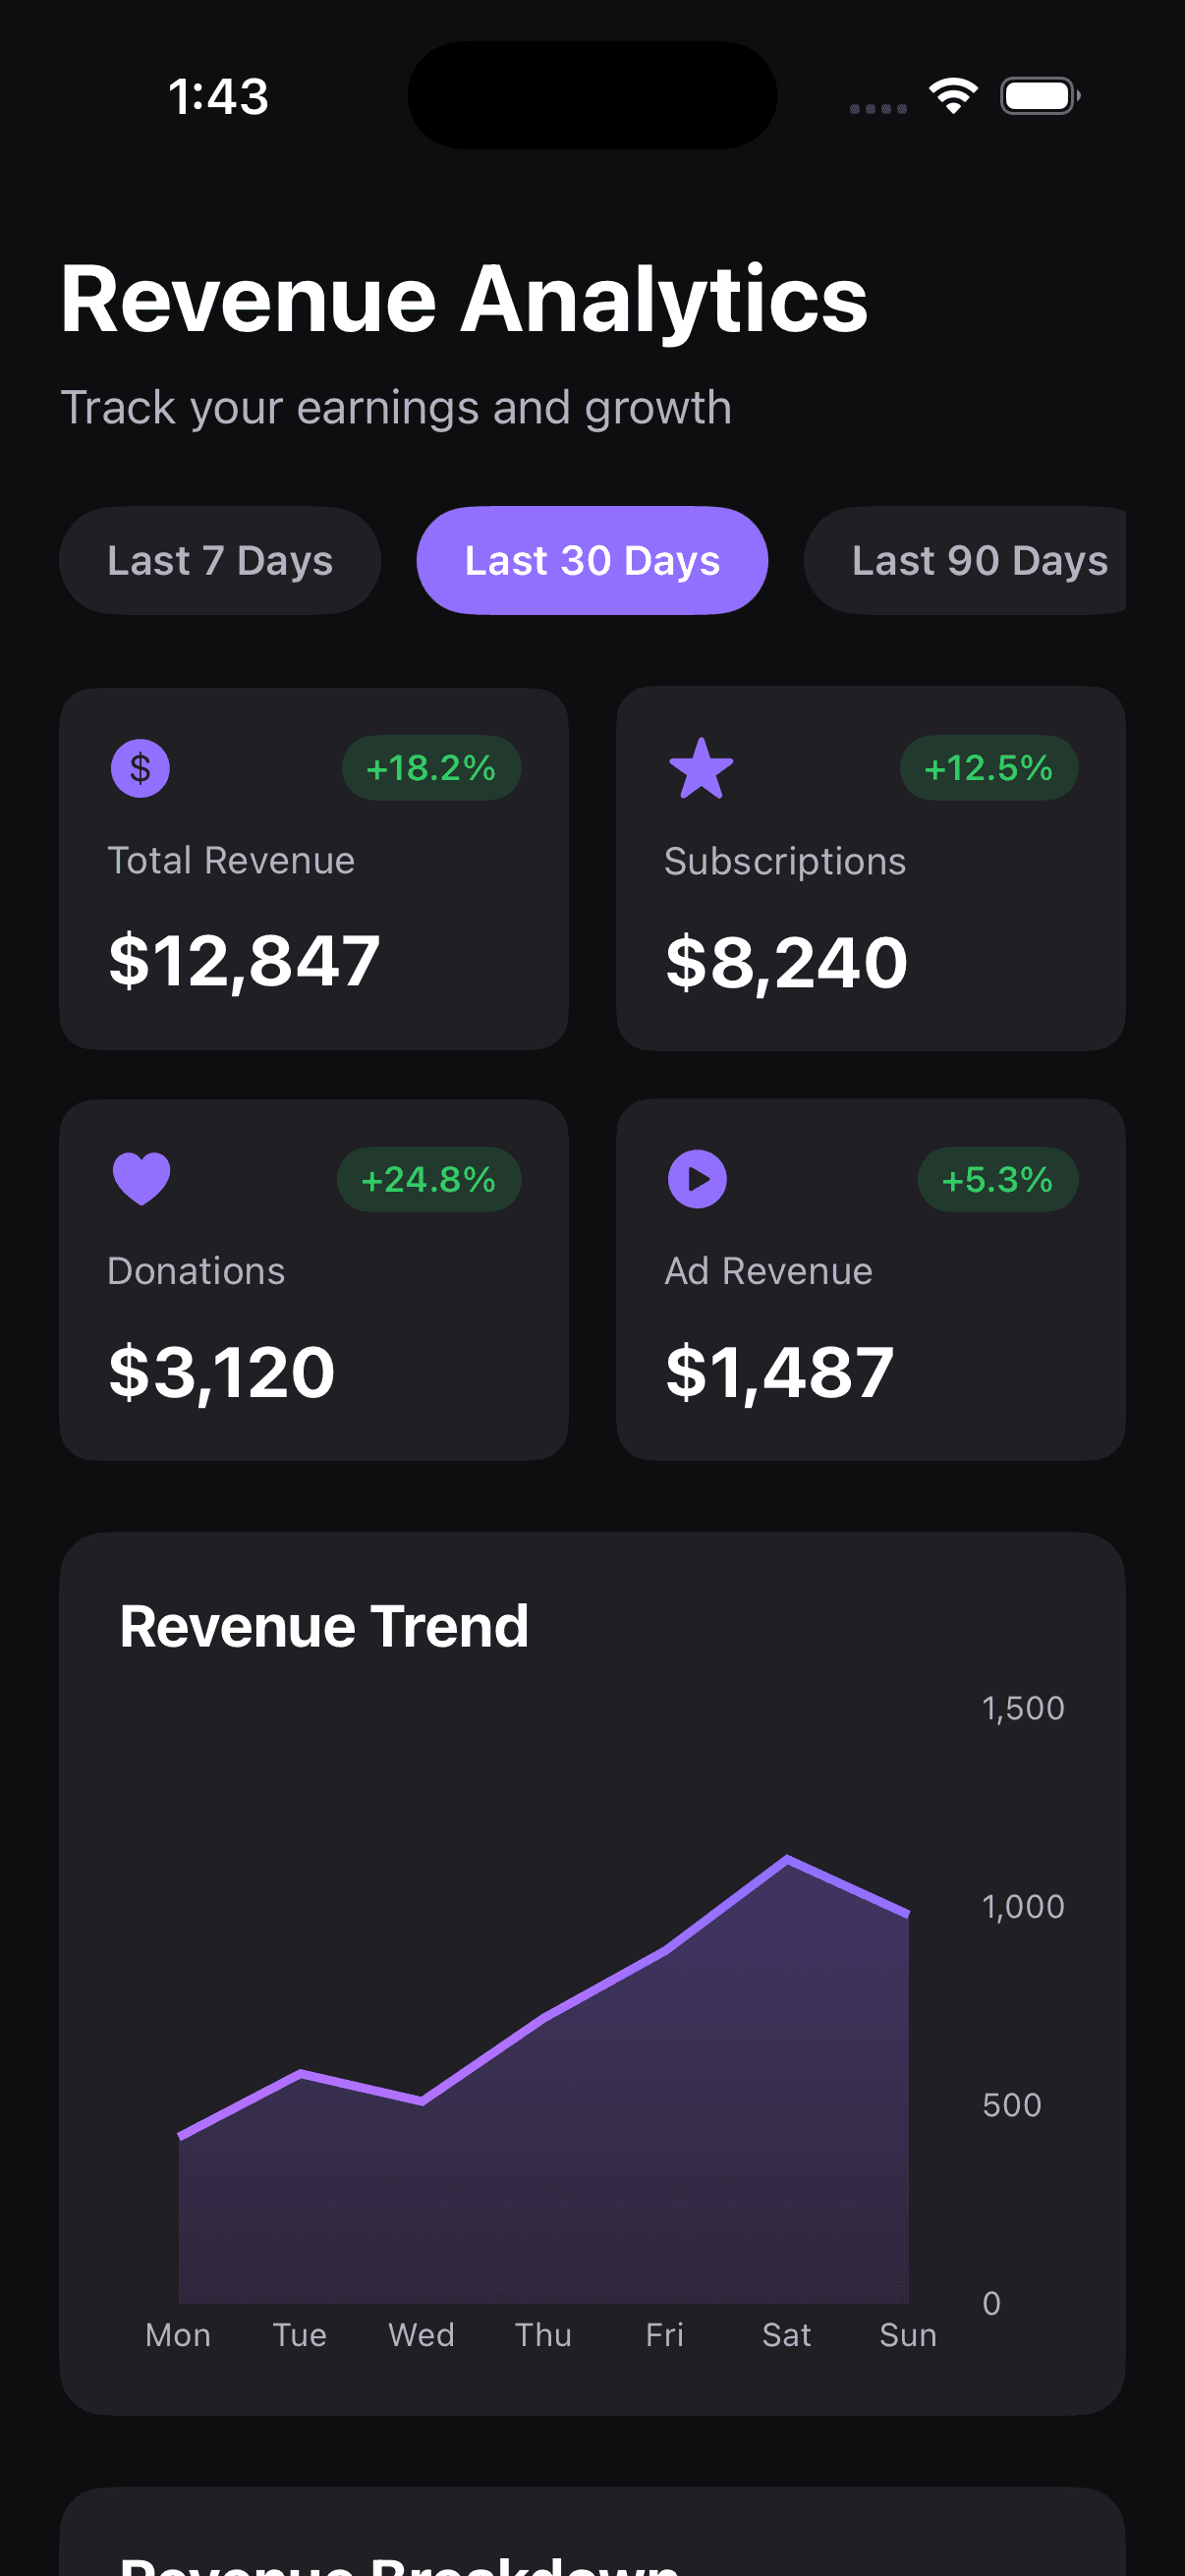
Creator Revenue Analytics
by dockui
Revenue dashboard UI with charts, financial metrics, top revenue sources, recent transactions, and interactive analytics layout
- Platform
- SwiftUI
- Code
- Native Swift
- Format
- Screen
- Access
- Free
Code Snippet
import SwiftUI
import Charts

struct RevenueAnalyticsView: View {
    @State private var selectedTimeRange = "Last 30 Days"

    let timeRanges = ["Last 7 Days", "Last 30 Days", "Last 90 Days", "This Year"]

    // Revenue metrics
    let revenueMetrics: [RevenueMetric] = [
        RevenueMetric(title: "Total Revenue", value: "$12,847", trend: "+18.2%", isPositive: true, icon: "dollarsign.circle.fill"),
        RevenueMetric(title: "Subscriptions", value: "$8,240", trend: "+12.5%", isPositive: true, icon: "star.fill"),
        RevenueMetric(title: "Donations", value: "$3,120", trend: "+24.8%", isPositive: true, icon: "heart.fill"),
        RevenueMetric(title: "Ad Revenue", value: "$1,487", trend: "+5.3%", isPositive: true, icon: "play.circle.fill")
    ]

    // Revenue chart data
    let revenueData: [RevenueDataPoint] = [
        RevenueDataPoint(day: "Mon", revenue: 420),
        RevenueDataPoint(day: "Tue", revenue: 580),
        RevenueDataPoint(day: "Wed", revenue: 510),
        RevenueDataPoint(day: "Thu", revenue: 720),
        RevenueDataPoint(day: "Fri", revenue: 890),
        RevenueDataPoint(day: "Sat", revenue: 1120),
        RevenueDataPoint(day: "Sun", revenue: 980)
    ]

    // Top revenue sources
    let revenueSources: [RevenueSource] = [
        RevenueSource(name: "Tier 1 Subs", amount: 3240, percentage: 25.2, color: Color(red: 0.57, green: 0.44, blue: 1.0)),
        RevenueSource(name: "Tier 2 Subs", amount: 2800, percentage: 21.8, color: Color(red: 0.66, green: 0.44, blue: 1.0)),
        RevenueSource(name: "Tier 3 Subs", amount: 2200, percentage: 17.1, color: Color(red: 0.75, green: 0.44, blue: 1.0)),
        RevenueSource(name: "Bits", amount: 1850, percentage: 14.4, color: Color(red: 0.84, green: 0.44, blue: 1.0)),
        RevenueSource(name: "Donations", amount: 1757, percentage: 13.7, color: Color(red: 0.93, green: 0.44, blue: 1.0)),
        RevenueSource(name: "Ads", amount: 1000, percentage: 7.8, color: Color(red: 0.57, green: 0.30, blue: 0.85))
    ]

    var body: some View {
        ZStack {
            // Twitch dark background
            Color(red: 0.055, green: 0.055, blue: 0.063)
                .ignoresSafeArea()

            ScrollView {
                VStack(spacing: 24) {
                    // Header
                    headerSection

                    // Time range selector
                    timeRangeSelector
                        .padding(.horizontal, 20)

                    // Revenue metrics grid
                    LazyVGrid(columns: [
                        GridItem(.flexible(), spacing: 16),
                        GridItem(.flexible(), spacing: 16)
                    ], spacing: 16) {
                        ForEach(revenueMetrics) { metric in
                            RevenueMetricCard(metric: metric)
                        }
                    }
                    .padding(.horizontal, 20)

                    // Revenue chart
                    revenueChartSection
                        .padding(.horizontal, 20)

                    // Revenue breakdown
                    revenueBreakdownSection
                        .padding(.horizontal, 20)

                    // Recent transactions
                    recentTransactionsSection
                        .padding(.horizontal, 20)
                }
                .padding(.vertical, 20)
            }
        }
    }

    private var headerSection: some View {
        VStack(alignment: .leading, spacing: 8) {
            Text("Revenue Analytics")
                .font(.system(size: 32, weight: .bold))
                .foregroundColor(.white)

            Text("Track your earnings and growth")
                .font(.system(size: 16))
                .foregroundColor(Color(red: 0.7, green: 0.7, blue: 0.75))
        }
        .frame(maxWidth: .infinity, alignment: .leading)
        .padding(.horizontal, 20)
    }

    private var timeRangeSelector: some View {
        ScrollView(.horizontal, showsIndicators: false) {
            HStack(spacing: 12) {
                ForEach(timeRanges, id: \.self) { range in
                    Button(action: {
                        selectedTimeRange = range
                    }) {
                        Text(range)
                            .font(.system(size: 14, weight: .semibold))
                            .foregroundColor(selectedTimeRange == range ? .white : Color(red: 0.7, green: 0.7, blue: 0.75))
                            .padding(.horizontal, 16)
                            .padding(.vertical, 10)
                            .background(
                                selectedTimeRange == range ?
                                Color(red: 0.57, green: 0.44, blue: 1.0) :
                                Color(red: 0.12, green: 0.12, blue: 0.14)
                            )
                            .clipShape(Capsule())
                    }
                }
            }
        }
    }

    private var revenueChartSection: some View {
        VStack(alignment: .leading, spacing: 16) {
            Text("Revenue Trend")
                .font(.system(size: 20, weight: .bold))
                .foregroundColor(.white)

            Chart {
                ForEach(revenueData) { point in
                    LineMark(
                        x: .value("Day", point.day),
                        y: .value("Revenue", point.revenue)
                    )
                    .foregroundStyle(
                        LinearGradient(
                            colors: [
                                Color(red: 0.57, green: 0.44, blue: 1.0),
                                Color(red: 0.75, green: 0.44, blue: 1.0)
                            ],
                            startPoint: .top,
                            endPoint: .bottom
                        )
                    )
                    .lineStyle(StrokeStyle(lineWidth: 3))

                    AreaMark(
                        x: .value("Day", point.day),
                        y: .value("Revenue", point.revenue)
                    )
                    .foregroundStyle(
                        LinearGradient(
                            colors: [
                                Color(red: 0.57, green: 0.44, blue: 1.0).opacity(0.3),
                                Color(red: 0.75, green: 0.44, blue: 1.0).opacity(0.1)
                            ],
                            startPoint: .top,
                            endPoint: .bottom
                        )
                    )
                }
            }
            .frame(height: 220)
            .chartXAxis {
                AxisMarks(values: .automatic) { _ in
                    AxisValueLabel()
                        .foregroundStyle(Color(red: 0.7, green: 0.7, blue: 0.75))
                }
            }
            .chartYAxis {
                AxisMarks(values: .automatic) { _ in
                    AxisValueLabel()
                        .foregroundStyle(Color(red: 0.7, green: 0.7, blue: 0.75))
                }
            }
        }
        .padding(20)
        .background(Color(red: 0.12, green: 0.12, blue: 0.14))
        .clipShape(RoundedRectangle(cornerRadius: 16))
    }

    private var revenueBreakdownSection: some View {
        VStack(alignment: .leading, spacing: 16) {
            Text("Revenue Breakdown")
                .font(.system(size: 20, weight: .bold))
                .foregroundColor(.white)

            VStack(spacing: 12) {
                ForEach(revenueSources) { source in
                    RevenueSourceRow(source: source)
                }
            }
        }
        .padding(20)
        .background(Color(red: 0.12, green: 0.12, blue: 0.14))
        .clipShape(RoundedRectangle(cornerRadius: 16))
    }

    private var recentTransactionsSection: some View {
        VStack(alignment: .leading, spacing: 16) {
            Text("Recent Activity")
                .font(.system(size: 20, weight: .bold))
                .foregroundColor(.white)

            VStack(spacing: 12) {
                ForEach(recentTransactions.prefix(5)) { transaction in
                    TransactionRow(transaction: transaction)
                }
            }
        }
        .padding(20)
        .background(Color(red: 0.12, green: 0.12, blue: 0.14))
        .clipShape(RoundedRectangle(cornerRadius: 16))
    }

    let recentTransactions: [Transaction] = [
        Transaction(type: "Subscription", amount: 24.99, user: "GamerPro123", time: "2h ago", icon: "star.fill"),
        Transaction(type: "Donation", amount: 50.00, user: "StreamFan", time: "5h ago", icon: "heart.fill"),
        Transaction(type: "Bits", amount: 100, user: "Viewer2024", time: "8h ago", icon: "sparkles"),
        Transaction(type: "Subscription", amount: 9.99, user: "CoolStreamer", time: "12h ago", icon: "star.fill"),
        Transaction(type: "Donation", amount: 15.00, user: "Fan123", time: "1d ago", icon: "heart.fill")
    ]
}

// MARK: - Revenue Metric Card

struct RevenueMetricCard: View {
    let metric: RevenueMetric

    var body: some View {
        VStack(alignment: .leading, spacing: 12) {
            HStack {
                Image(systemName: metric.icon)
                    .font(.system(size: 20))
                    .foregroundColor(Color(red: 0.57, green: 0.44, blue: 1.0))

                Spacer()

                Text(metric.trend)
                    .font(.system(size: 12, weight: .semibold))
                    .foregroundColor(metric.isPositive ? Color(red: 0.2, green: 0.8, blue: 0.4) : .red)
                    .padding(.horizontal, 8)
                    .padding(.vertical, 4)
                    .background(
                        (metric.isPositive ? Color(red: 0.2, green: 0.8, blue: 0.4) : .red)
                            .opacity(0.15)
                    )
                    .clipShape(Capsule())
            }

            Text(metric.title)
                .font(.system(size: 13))
                .foregroundColor(Color(red: 0.7, green: 0.7, blue: 0.75))

            Text(metric.value)
                .font(.system(size: 24, weight: .bold))
                .foregroundColor(.white)
        }
        .padding(16)
        .frame(maxWidth: .infinity, alignment: .leading)
        .background(Color(red: 0.12, green: 0.12, blue: 0.14))
        .clipShape(RoundedRectangle(cornerRadius: 12))
    }
}

// MARK: - Revenue Source Row

struct RevenueSourceRow: View {
    let source: RevenueSource

    var body: some View {
        VStack(spacing: 8) {
            HStack {
                Text(source.name)
                    .font(.system(size: 14, weight: .medium))
                    .foregroundColor(.white)

                Spacer()

                Text("$\(Int(source.amount))")
                    .font(.system(size: 14, weight: .semibold))
                    .foregroundColor(.white)
            }

            GeometryReader { geometry in
                ZStack(alignment: .leading) {
                    Rectangle()
                        .fill(Color(red: 0.18, green: 0.18, blue: 0.20))
                        .frame(height: 6)
                        .clipShape(Capsule())

                    Rectangle()
                        .fill(source.color)
                        .frame(width: geometry.size.width * (source.percentage / 100), height: 6)
                        .clipShape(Capsule())
                }
            }
            .frame(height: 6)
        }
    }
}

// MARK: - Transaction Row

struct TransactionRow: View {
    let transaction: Transaction

    var body: some View {
        HStack(spacing: 12) {
            ZStack {
                Circle()
                    .fill(Color(red: 0.57, green: 0.44, blue: 1.0).opacity(0.2))
                    .frame(width: 40, height: 40)

                Image(systemName: transaction.icon)
                    .font(.system(size: 18))
                    .foregroundColor(Color(red: 0.57, green: 0.44, blue: 1.0))
            }

            VStack(alignment: .leading, spacing: 4) {
                Text(transaction.type)
                    .font(.system(size: 14, weight: .semibold))
                    .foregroundColor(.white)

                Text(transaction.user)
                    .font(.system(size: 12))
                    .foregroundColor(Color(red: 0.7, green: 0.7, blue: 0.75))
            }

            Spacer()

            VStack(alignment: .trailing, spacing: 4) {
                Text("$\(String(format: "%.2f", transaction.amount))")
                    .font(.system(size: 14, weight: .bold))
                    .foregroundColor(.white)

                Text(transaction.time)
                    .font(.system(size: 11))
                    .foregroundColor(Color(red: 0.7, green: 0.7, blue: 0.75))
            }
        }
        .padding(.vertical, 8)
    }
}

// MARK: - Models

struct RevenueMetric: Identifiable {
    let id = UUID()
    let title: String
    let value: String
    let trend: String
    let isPositive: Bool
    let icon: String
}

struct RevenueDataPoint: Identifiable {
    let id = UUID()
    let day: String
    let revenue: Double
}

struct RevenueSource: Identifiable {
    let id = UUID()
    let name: String
    let amount: Double
    let percentage: Double
    let color: Color
}

struct Transaction: Identifiable {
    let id = UUID()
    let type: String
    let amount: Double
    let user: String
    let time: String
    let icon: String
}
More Templates
More Templates
View All TemplatesSimilar Blogs
View All Articles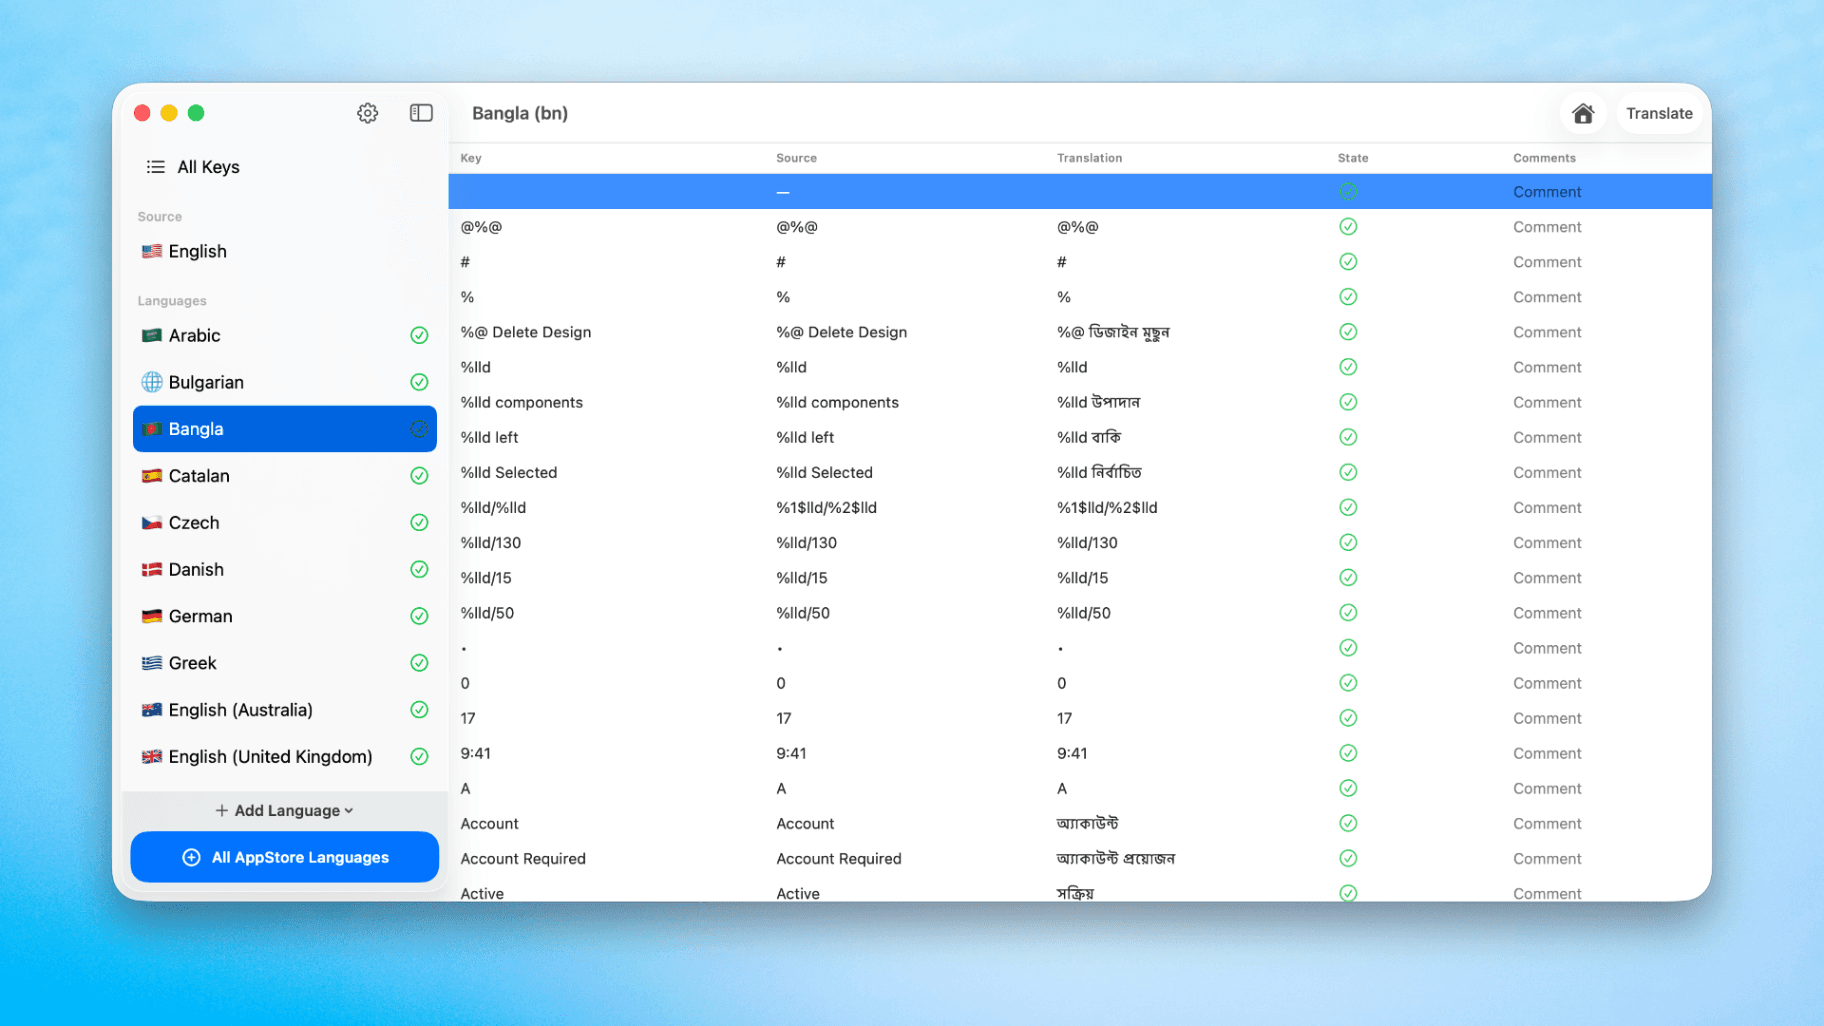
How to Translate Xcode String Catalogs with AI
Learn how to efficiently translate Xcode string catalogs using AI fast, streamlining localization for your iOS and SwiftUI applications.
by dockui
May 4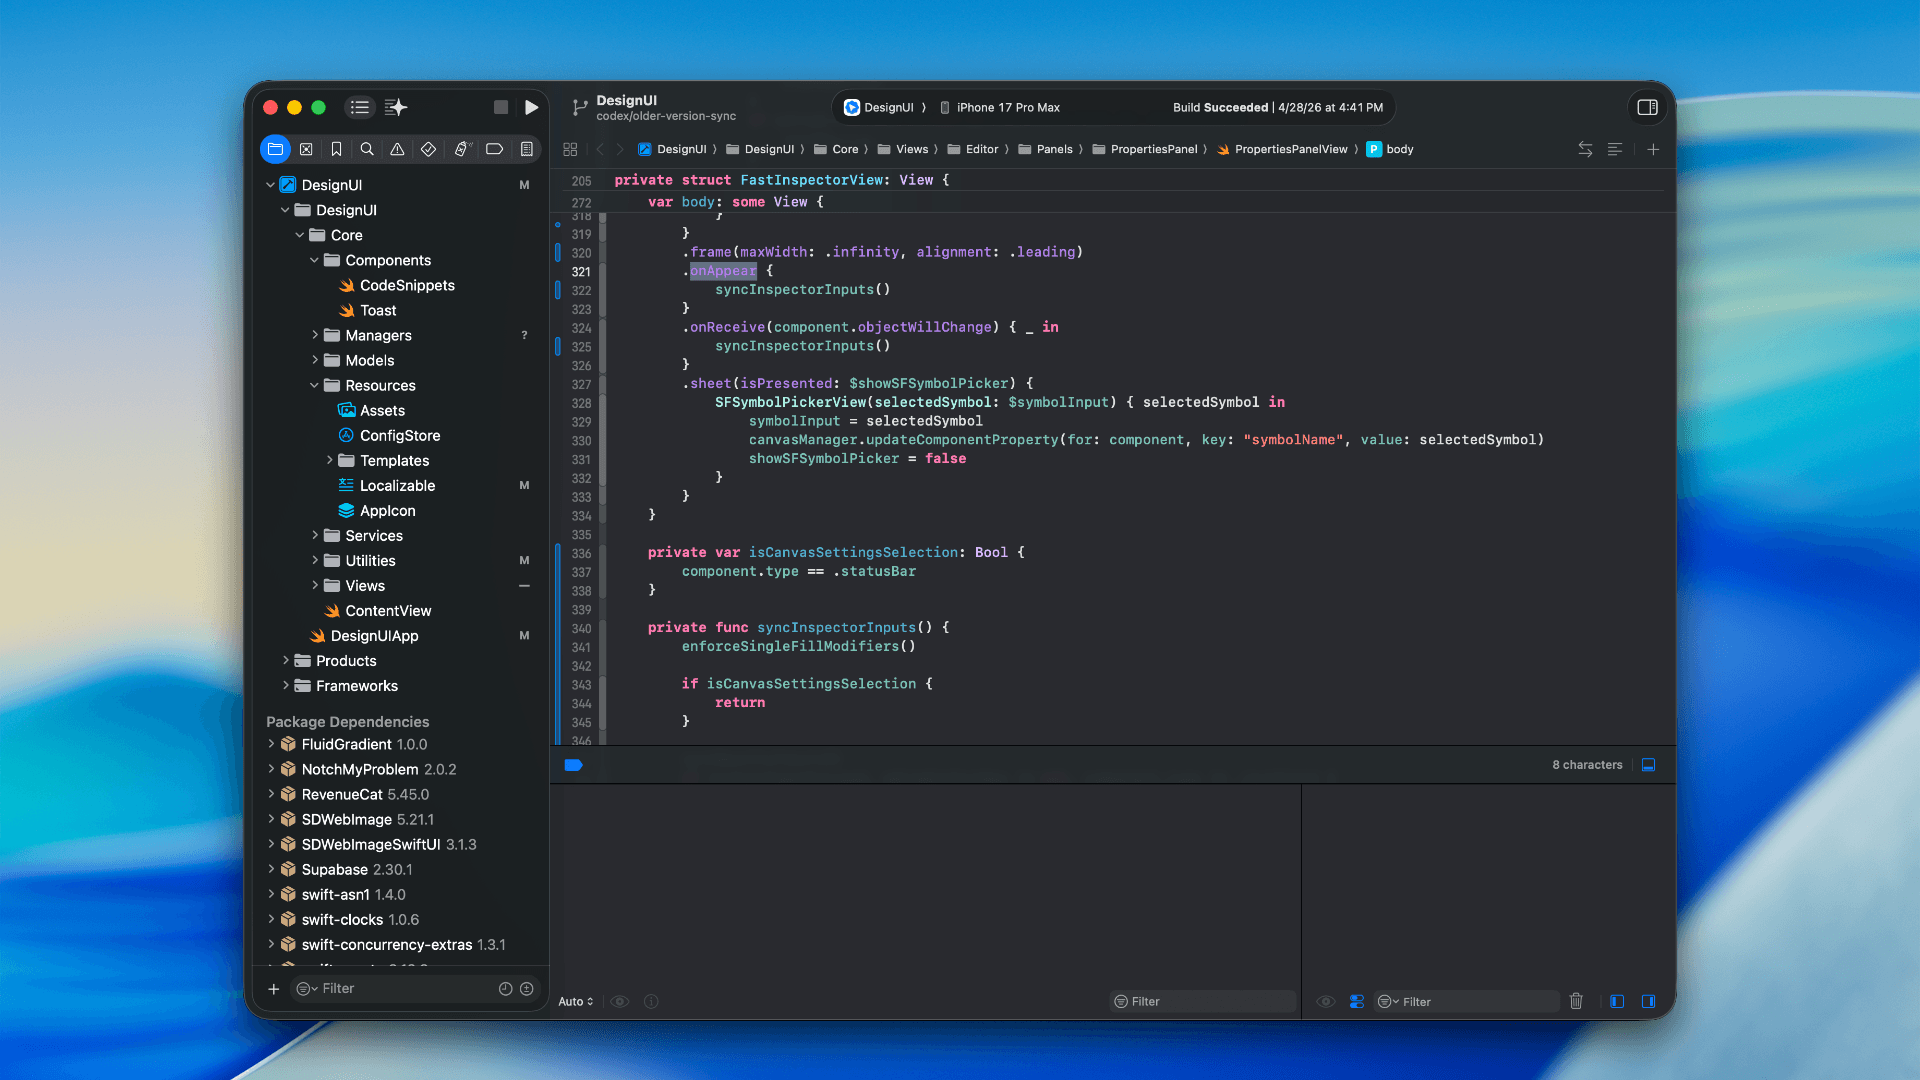
How to optimize your SwiftUI app in 2026
Discover top strategies to optimize your SwiftUI app in 2026, enhancing performance, responsiveness, and maintainability with modern concurrency.
by dockui
Apr 29
SwiftUI: iOS Confirmation Alert (Confirm + Cancel)
SwiftUI iOS confirmation alert with Confirm and Cancel buttons. Beginners guide to building safe actions, destructive deletes, and commit dialogs.
by dockui
Nov 11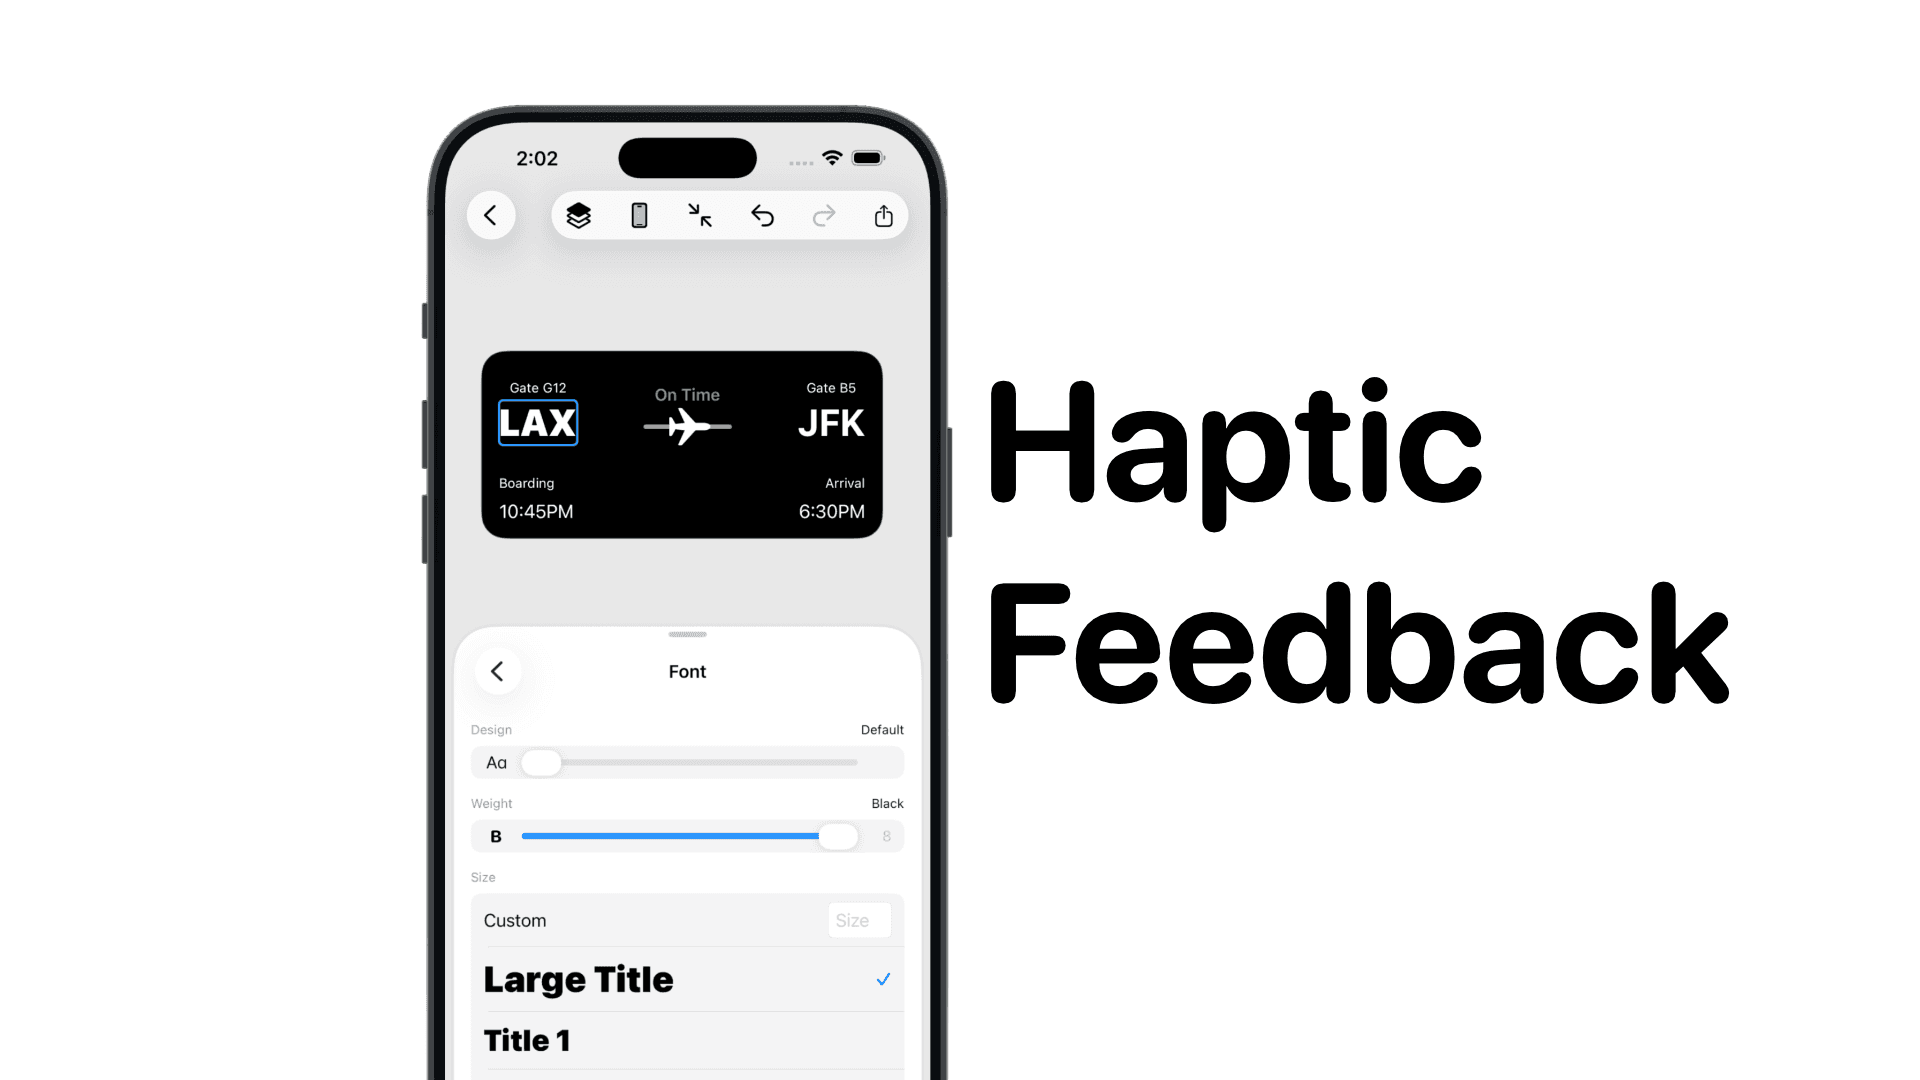
SwiftUI: IOS Haptic Feedback Guide 2026
Add click to vibrate haptic feedback in SwiftUI. Full guide to UIImpactFeedbackgenerator, success, error, selection, and tap vibration patterns with code.
by dockui
Nov 11Code copied to clipboard!